At the Microsoft Professional Developers conference as couple of weeks ago, I attended an excellent session on Windows Azure diagnostics. Microsoft has made the video of this session available and you can check it out here:
Windows Azure Monitoring, Logging, and Management APIs
http://microsoftpdc.com/Sessions/SVC15 (I also embed the video below)
We followed some of the principles defined in the above session and turned on monitoring on our currently cloud deployed web and worker roles. Lanh, my co-worker, just finished the first version of our “Windows Azure Monitoring” application and we can now visualize this data – check out an example of our graphs:
Visualizing Windows Azure web and worker roles performance counters
Click on image to zoom in
We can see CPU and RAM usage by hour, by day and for the last week. Our system collects the data automatically from Azure storage or on demand. We keep one week of raw data, but the aggregate data (e.g. the graph data) we don’t delete. I think the graphs above are awesome – it’s like art!
I believe Microsoft will eventually have some cool tools for us in the Windows Azure portal , but having this custom Windows Azure diagnostics application will be useful regardless. For example, right now we will manually increase or decrease the number of web and worker role instances based on the performance counters above. But eventually we may use the Windows Azure Management APIs and allow this application to do it for us.
See below for more information on how we designed and implemented the above graphs.
Visualizing Windows Azure diagnostic data
We created this application after attending the “Windows Azure Monitoring, Logging, and Management APIs” session at the Microsoft Professional Developers Conference 2009 – I embed the video below:
Watch the video above if you haven’t already done so – the information below will make a lot more sense. Also, Silverlight is required to watch the video – install it here.
To end up with the graphs above, we first defined 4 performance counters we wanted to keep track of:
- \ASP.NET Applications(__Total__)\Requests/Sec
- \Processor(0)\% Processor Time
- \Memory\Available Bytes
- \WFPv4\Active Outbound Connections
For each of our 3 web roles and 1 worker role we logged each of the performance counters above into Azure storage every minute. By using Cerebrata’s excellent Cloud Storage Studio we were then able to manually view each of the performance counters – here’s a screenshot of the raw data:
Windows Azure web and worker role performance counters –
click on image to enlarge
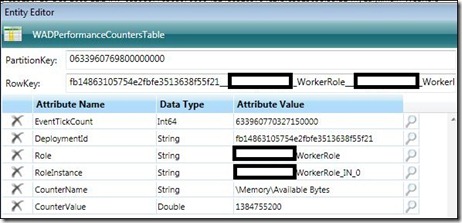
Note that I blanked out some of our project names. Let’s look at the details of one of the events:
In this case, we had a web role with two instances, so we are seeing that this event corresponds to the first instance (“_IN_0”) – we can see the number of available bytes in RAM for this web role instance.
With 4 role instances, at 4 performance counters per instance per minute, we are logging to Azure Storage:
- 16 events per minute.
- 960 events per hour.
- 23,040 events per day.
- 161,280 events per week.
- 691,200 events in a 30-day month.
That’s a lot of data! That’s the reason we decided to keep one week of raw data, but the aggregate data (e.g. the graph data) we don’t delete.
Our application connects to Azure storage every few minutes and grabs the latest events. It stores them in an on-premise SQL Server and deletes them from Azure storage.
We then have an ASP.NET page which aggregates the data and creates these cool graphs:
Currently only our QA team is testing our web roles, so the CPU usage is fairly low. The peak on 12/3 of CPU usage to almost 100% is probably due to the deployment and initialization of the VM and role instances – that’s the day we upgraded our Azure services to the latest version of our CSPKG package.
Good times!


Comments